 Princeton IT Services
Resources / Blogs
4 Basic Techniques of Data Analytics
In this blog below, you will learn about the four primary forms of data analytics so you can get the most information possible from your data.
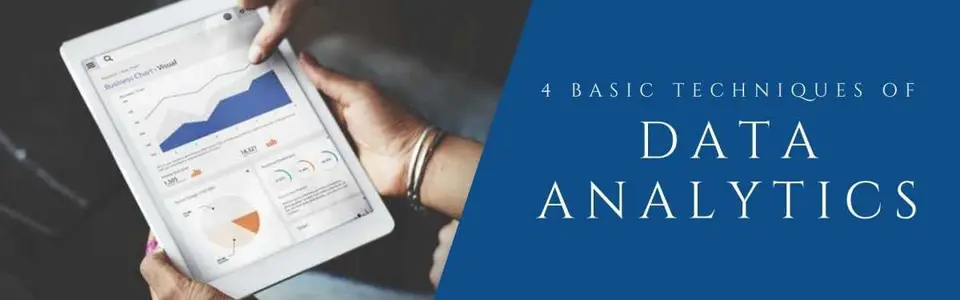
Running a successful organisation requires extensive data analysis. Effective data utilisation improves comprehension of a company’s historical performance and decision-making for its future operations. Data analysis is the procedure of modifying, analysing, and cleansing raw data in order to obtain useful, pertinent information that supports corporate decision-making. By offering insightful data and information, frequently displayed in charts, graphics, tables, and graphs, the technique assists in lowering the risks associated with decision-making.
In this blog below, you will learn about the four primary forms of data analytics so you can get the most information possible from your data.
Predictive Analysis
Predictive analysis examines past data to uncover important patterns and trends and integrates them further into machine learning systems. In order to forecast future events, the model is applied to the available data. Numerous organisations like it because of its multiple benefits, including its data volume and variety, quicker and less expensive computers, user-friendly software, tighter economic circumstances, and requirement for competitive difference.
Prescriptive Analysis
Prescriptive analytics makes recommendations for various actions and discusses the possible outcomes that may result from predictive analysis. Prescriptive analysis that generates automated choices or recommendations needs a precise, one-of-a-kind algorithm, as well as explicit instructions from individuals using the analytical approaches.
Descriptive Analysis
Data mining and data aggregation are two essential techniques used for descriptive analysis to find patterns and trends in past records. Descriptive analysis is concerned with reflecting what has happened in the past, not inferring anything from its results or making predictions about the future. To rapidly identify trends and patterns, descriptive data can also be helpful.
Diagnostic Data Analysis
To identify the root of an abnormality, it looks at historical data. Diagnostic data analysis seeks to provide a “why did this happen?” explanation. Drill-down, data discovery, mining, and correlations are the strategies utilised in diagnostic data analysis. Data analysts utilize the data discovery approach to locate sources that might aid in their efforts to infer causes from results. Data mining is the automated extraction of knowledge from a vast body of unstructured data. Finding connections or patterns between various data sources is how diagnostic analytics produce its results.
Conclusion
Processes and techniques for data analysis may make use of automated systems, simulations, and applications that operate on machine learning algorithms.
They assist businesses in analysing their marketing efforts, developing goods, customising content, and better understanding their customers. If you still want to learn more about data analysis, contact us at Princeton IT Services.
 Data issues tracked from detection to fix